Graphing calculator plus 84 83
- 2.09K
- 4.6
- Installs
- 1.00M
- Price
- Free
Screenshots
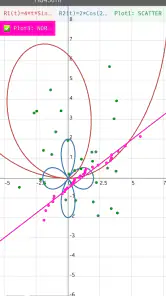
Analysis by Reviewed
I approached Graphing calculator plus 84 83 as the kind of tool you keep nearby when a basic calculator stops being enough. It is an Android education app from lethinhien, focused on graphing, equations, algebra, mathematics, and fractions. After using it for typical study and problem-solving tasks, my impression is that it aims to put a more capable scientific and graphing calculator on a phone without charging an upfront price.
That makes it interesting for students, parents helping with homework, and anyone who wants to check a mathematical model away from a desk. It is free to install, rated for Everyone, and supports Android 7.0 or later. Optional in-app purchases range from $0.99 to $3.99 per item, so the basic entry point is easy, although users who want every available option should pay attention to what is offered inside the app.
How the calculator feels in current everyday use
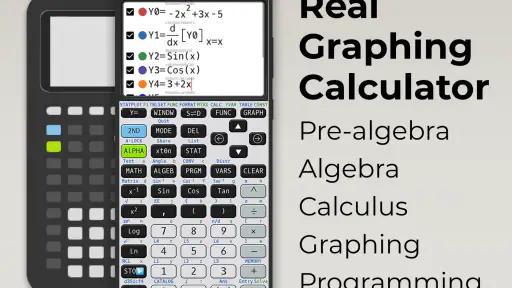
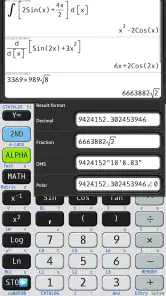
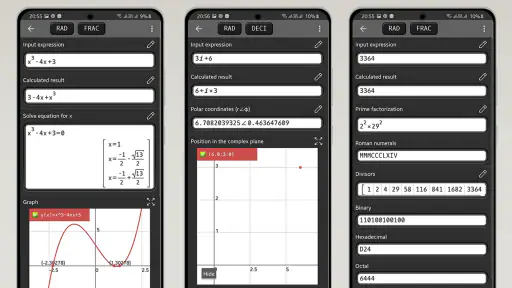
The strongest part of the experience is the breadth suggested by its layout and purpose. This is not merely a four-operation calculator with a graph button added as an afterthought. The app is built around the idea that one workspace should handle expressions, fractions, algebraic rearrangement, equation solving, and visual graphs. That combination is especially useful when I want to move from a symbolic question to a visual check without switching between several apps.
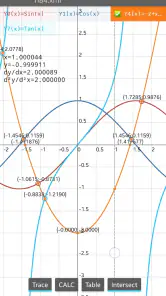
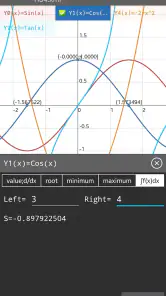
For a student, the practical workflow is straightforward in principle: enter an expression, inspect the result, then use a graph to understand how the expression behaves. That last step matters because a numerical answer can look correct while the shape of a function reveals an incorrect sign, an unexpected intercept, or a domain problem. I found the graphing role more valuable as a way to verify understanding than as a decorative visual feature.
The app also makes sense for fraction work. Fractions are often awkward in ordinary phone calculators because users have to convert everything to decimals first. Keeping fractional values visible can help when checking homework or following a textbook method. It is easier to spot whether an answer has been simplified sensibly when the result remains mathematically readable instead of becoming a long decimal.
Its broad audience is reflected in the Everyone content rating, but that does not mean every user will find it equally comfortable. A beginner who only needs percentages, tips, or quick arithmetic may find the interface more involved than necessary. In that situation, the calculator already built into the phone is faster. This app earns its place when the problem involves relationships between values rather than one isolated calculation.
Where it fits better than ordinary calculator apps
Most basic calculator apps are optimized for speed: tap numbers, choose an operation, and read the answer. Graphing calculator plus 84 83 is better suited to exploration. If I am examining a quadratic expression, comparing two equations, or checking how changing a coefficient affects a curve, a standard calculator forces me to repeat too much manual work. A graphing-focused tool reduces that friction by keeping the expression and its visual result connected.
It can also be more useful than a general note-taking app with a calculator pasted into it. Notes are good for recording a solution, but they do not replace a dedicated environment for testing several forms of an equation. Conversely, a full desktop mathematics package may offer more room and sophistication, but it is less convenient when I am working from a phone during a commute, in a classroom, or beside a printed worksheet.
That comparison comes with an important trade-off. A phone screen is still a phone screen. Long expressions, multiple graph lines, and dense algebraic notation can become harder to inspect than they would be on a tablet or computer. I would use this app for checking, experimenting, and studying on the go, but I would not assume that a mobile display is automatically the best place to prepare a polished mathematical presentation.
A useful workflow for homework and self-study
One of the most effective ways to use the app is to separate solving from checking. I would first attempt a problem on paper, then enter the original equation rather than immediately typing the expected answer. The graph can provide a second perspective, while the equation-solving tools can help identify where my handwritten steps went wrong. This approach turns the app into a tutor-like checker instead of a shortcut that simply produces an answer.
For example, imagine I am working through a word problem involving a changing quantity. I can translate the situation into an equation on paper, enter it into the calculator, and then inspect whether the graph behaves as the story suggests. If the quantity should increase but the line slopes downward, that visual contradiction gives me a useful clue. The app does not replace the reasoning, but it makes mistakes easier to locate.
A second practical habit is to keep exact forms as long as possible. When working with fractions, I would avoid converting to decimals at the beginning unless the exercise specifically requires an approximation. Exact forms make later comparisons clearer and reduce rounding confusion. Only after the algebra is complete would I use a decimal result for a real-world interpretation, such as estimating a measurement or comparing costs.
A third tip is to use graphs selectively. Plotting every intermediate expression can create visual clutter and make the screen less informative. I get more from a graph when I decide in advance what I am checking: an intersection, a turning point, a zero, or the general direction of change. That small discipline is particularly useful on a phone, where too many lines can be difficult to distinguish.
What the current version tells existing users
The current version is 7.5.1.483, which suggests this is not an abandoned experiment that stopped after an initial release. The app first appeared on February 3, 2020, and its continued version history gives existing users a reason to expect a maintained product rather than a one-off calculator. I would still judge any update by how it affects daily entry and readability, because mathematical tools depend heavily on interface consistency.
For someone already using an older release, the sensible approach is to review a few familiar calculations after updating. Try a fraction, a graph, and an equation that you know well. That is not because an update is necessarily risky, but because small changes in input behavior, symbols, or result formatting can affect a student’s routine. A calculator can remain mathematically capable while still feeling different if buttons or menus move.
The app’s scale also provides useful context. It has passed one million installs, with an average rating of 4.6 from around fourteen thousand ratings and roughly two thousand one hundred written reviews. Those figures indicate that many people find the concept worthwhile, but they should not be treated as proof that every learner will enjoy the interface. A graphing calculator is a specialized tool, and satisfaction depends strongly on whether the user needs graphing and algebra in the first place.
Existing users who rely on the app for schoolwork should also remember that a calculated result is not the same as a complete solution. Teachers may expect visible transformations, stated assumptions, or a particular method. I would use the app to verify my work and explore alternatives, then write the reasoning in the format required by the class. That habit protects against the common problem of submitting an answer without understanding how it was obtained.
Where the app still has limits
The largest limitation is not necessarily mathematical; it is the learning curve created by putting many functions into a compact mobile interface. A user who has never worked with graphing calculators may need time to understand how to enter expressions naturally. Parentheses, exponents, fractions, and variables are easy to mistype on a small touchscreen, and one misplaced symbol can produce a result that looks plausible.
I would therefore avoid entering a long expression in one rushed pass. Building it in smaller pieces and checking each part is slower at first but usually faster than debugging an entire line later. This is one area where a physical keyboard or desktop mathematics program remains more comfortable. The mobile advantage is portability, not necessarily the best typing experience.
Another limitation is that a visual graph can encourage false confidence. A curve that looks right at one zoom level may hide important behavior elsewhere. When I use a graph, I treat it as evidence to inspect, not as a final proof. Important values should still be checked symbolically or numerically, especially when an intersection or root determines the answer to a real problem.
The free price is appealing, but users should distinguish between free access and a completely purchase-free experience. The app includes optional items priced from $0.99 to $3.99 each. That does not make it unsuitable, yet it is worth deciding whether the free functions already cover your needs before buying anything. For a student who only needs occasional equation checks, the free starting point may be enough; for frequent use, understanding the available paid options becomes part of choosing the app responsibly.
I would also skip it if my needs are limited to advanced professional mathematics, formal symbolic proofs, or highly polished desktop-style visualization. The app’s focus is practical calculation and graphing on Android, not a replacement for every specialized mathematical environment. Users who need extensive document creation, collaboration, or large-screen graph analysis may be better served by a computer-based alternative.
Who should install it, and who should choose something simpler
I think it is a strong candidate for secondary-school and early college students who regularly move between algebra, fractions, equations, and graphs. It is also useful for independent learners who want to test examples while studying a concept. The ability to compare an equation with its visual behavior gives the app more educational value than a calculator that only returns a number.
It can help parents, too. When a child asks why an answer is wrong, entering both the child’s expression and the corrected version can make the difference visible. A graph may show that two formulas intersect only at one value, while fraction handling can reveal where a simplification changed the result. This is more constructive than simply announcing which answer is correct.
On the other hand, I would recommend a simpler calculator for someone who wants quick arithmetic with minimal setup. A dedicated graphing tool can feel excessive for splitting a bill or checking a percentage. I would also consider a larger-screen alternative for users with visual difficulties or anyone who expects to compare many equations at once. The app’s portability is its main advantage, and that advantage matters less when readability is the priority.
What to watch as you continue using it
For new users, the first thing I would watch is whether the input style becomes comfortable after several short sessions. If entering expressions still feels error-prone, the issue may be the phone format rather than the app’s mathematical scope. Practicing with simple equations before attempting a complicated graph is a better test than judging it after one rushed homework problem.
I would also watch how well the app fits your personal study method. If you use it to generate answers without writing down the steps, it may weaken your understanding. If you use it to compare predictions, inspect graphs, and locate errors, it becomes much more valuable. The same feature can either support learning or encourage dependence, depending on the workflow around it.
Updates are another sensible point to monitor. With version 7.5.1.483 currently in place, existing users should pay attention to changes that affect expression entry, graph readability, and the handling of familiar calculations. Those details matter more to me than a long list of added functions because they determine whether the app remains dependable during everyday study.
My overall view is positive, with a clear qualification: this is best understood as a portable mathematics workspace, not a universal replacement for every calculator or computer program. It offers a useful mix of graphing, algebra, equation solving, and fraction work at no initial cost, and its established user base shows that the approach has practical appeal. If you want to see what an equation is doing rather than merely read its answer, this app is worth trying.
I would recommend starting with short, familiar problems, then gradually adding graphs and more involved expressions. That lets you learn the interface while checking whether the app matches your schoolwork or personal projects. For me, its real strength is the connection between symbolic calculation and visual understanding. Its real weakness is the inevitable friction of doing detailed mathematics on a small touchscreen. If that balance suits you, Graphing calculator plus 84 83 can become a genuinely useful companion for everyday learning.
Pros
- Includes familiar TI-83/TI-84-style functions for everyday calculations.
- Supports graph plotting
- making equations easier to visualize.
- Useful for students studying algebra
- trigonometry
- and precalculus.
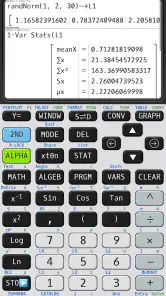
- Offers advanced scientific and statistical calculation tools.
- More convenient than carrying a physical calculator to class.
Cons
- The interface may feel dated compared with modern calculator apps.
- Some features can take time to learn without a built-in tutorial.
- Small phone screens may make graph editing and data entry awkward.
- Performance and available functions may vary between device models.
- It may not be accepted during exams that require an approved calculator.
- Category
- Education
- Version
- 7.5.1.483