Desmos Graphing Calculator
- 1.71K
- 4.6
- Installs
- 10.00M
- Price
- Free

Screenshots
Analysis by Reviewed
I use a graphing calculator when I want to understand a problem, not merely produce its final number. That is where Desmos Graphing Calculator makes a strong first impression: it turns equations into something I can see, adjust, and investigate without carrying a physical calculator. It is a free education app from Desmos Inc, suitable for everyone, and its focus is clear rather than overloaded.
After spending time with it, I see it as more than a digital replacement for a school calculator. It is a visual workspace for functions, tables, sliders, and graphs, with enough flexibility for homework, classroom demonstrations, self-study, and quick checks on a phone. The main question is not whether it can draw a graph; it can. The more useful question is whether it remains comfortable and dependable when a simple exercise turns into a page full of expressions.
How Desmos feels during real mathematical work
Quick starts and sensible speed expectations
The app is at its best when I open it with a specific question. Entering an expression and seeing the curve appear feels immediate in normal use, and the visual response makes experimentation much faster than repeatedly typing values into a traditional calculator. I can change a coefficient, inspect the result, and move on without rebuilding the calculation from scratch.
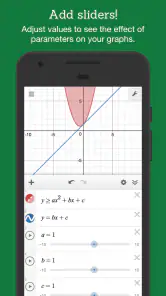
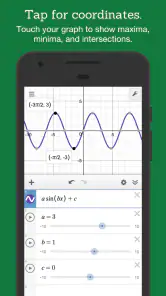
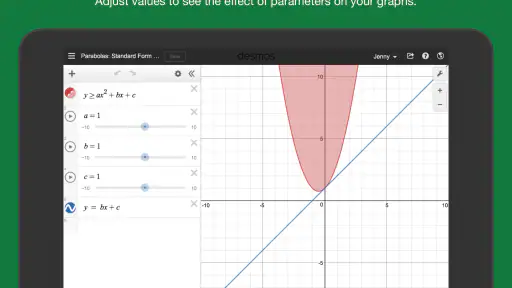
That responsiveness matters most with sliders. Instead of testing a parameter manually, I can vary it and watch the graph change. This turns a question such as “what happens when the slope increases?” into an active experiment. For a student, that can reveal a relationship more clearly than a finished answer ever could.
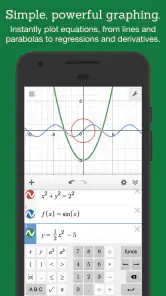
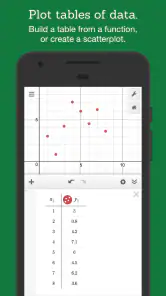
The interface also reduces the small delays that often make mathematics feel tedious. Expressions stay visible, so I can compare several lines or curves at once. A table can sit alongside a graph, helping me connect numerical values with the shape on screen. I find this especially useful when checking whether an equation was entered correctly, because a strange graph often exposes a typo immediately.
There is a trade-off, though. A graphing calculator is only fast when the input is clear. On a phone, entering long expressions, fractions, exponents, and nested parentheses can still be slower than writing them on paper. The app removes arithmetic friction, but it does not remove the need to organize a problem before typing it.
What happens when a graph becomes busy
Simple work is not a meaningful test of any graphing tool, so I deliberately think about heavier sessions: several functions on one screen, changing parameters repeatedly, switching between equations and tables, and examining a graph closely. Desmos is designed around this kind of exploration, and its strength is that the workspace remains understandable as the investigation grows.
You May Like

Clash of Clans Is Won Between the Battles

Android Auto Makes the Case for Quieter Car Software

MobiOffice: Transforming Mobile Productivity with Seamless Integration

EA SPORTS FC™ Mobile Soccer: Redefining Mobile Sports Gaming

How Microsoft OneDrive Became a Mobile Productivity Giant

How Google Translate Breaks Language Barriers Effortlessly
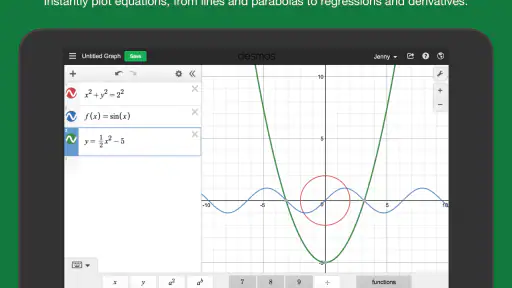
When I add several expressions, the color separation helps me identify which line or curve I am looking at. I can hide an expression temporarily rather than deleting it, which is a small but valuable habit when comparing cases. For a classroom explanation, I would build the graph in stages: start with the base function, add a transformed version, then use a slider to show the effect of one variable. That workflow is clearer than presenting a crowded finished screen.
Heavy use also exposes the limits of a small display. A graph with many lines can become visually confusing, especially on a phone held in portrait orientation. Zooming helps, but it can also make it harder to maintain a sense of the overall shape. I prefer using a tablet or a larger screen when the purpose is analysis rather than a quick calculation.
One practical tip is to keep related expressions close together and use descriptive labels where appropriate. This sounds minor, but it makes returning to an older graph much easier. If I leave a worksheet with anonymous equations scattered through it, the app cannot compensate for my poor organization. The visual workspace rewards tidy thinking.
Reliability and recovering from interruptions
For everyday use, I value stability more than flashy extras. A calculator should let me return to a problem without making me wonder whether the work has vanished. Desmos has the feel of a focused tool rather than a resource-heavy entertainment app, and its narrow purpose works in its favor: there are fewer distractions between opening the app and examining a function.
I still treat important work carefully. Before closing a complicated investigation, I would make sure it is saved in the way I intend, especially if the graph is part of an assignment or a lesson. A screenshot can also be sensible when I need to preserve a particular visual result. This is not a criticism unique to Desmos; it is simply good practice whenever a calculation matters.
Recovery is also about remembering how the graph was built. If I use sliders, hidden expressions, or a table, the final picture may not explain the whole process. For repeatable work, I keep the expressions readable and avoid changing too many variables at once. That makes it easier to reconstruct the reasoning after an interruption.
In my experience, the app’s strongest reliability feature is conceptual rather than technical: every expression remains part of the visible workspace. That gives me a useful audit trail. Instead of trusting a single result, I can inspect the formula, the table values, and the graph together. If those three views disagree with what I expect, I know where to investigate.
Device limits and the minimum software requirement
The current version is 7.49.0.0, and the listed minimum operating-system requirement is 10. That requirement is important for anyone using an older phone or tablet. A device that cannot meet it is not a good candidate, regardless of how suitable the hardware might otherwise seem.
On a modern compatible device, I would expect the app to feel relatively light compared with large games or media-heavy applications, because its job is mathematical visualization. Still, graphing work can become demanding in a different way: the screen, keyboard, and available memory all affect comfort. A small phone may run the calculator adequately while making detailed work awkward.
For a quick homework check, a phone is enough. For a long session involving multiple graphs, tables, and parameter changes, a larger display is the better choice. This is a usability decision rather than a claim that the app requires powerful hardware. The calculations may be manageable, but the human task of reading and editing everything benefits from space.
I would also avoid judging the app only by how it handles a single equation. The real device constraint is the combination of input density and visual complexity. A student who mostly enters one function at a time will have a different experience from someone building a detailed model with several related expressions.
Useful workflows beyond simply drawing curves
The obvious use is checking a function, but the more interesting workflow is moving between symbolic, numerical, and visual views. I might enter an equation, create a table of selected values, and then compare those values with the curve. This helps catch mistakes that a calculator displaying only a number would hide.
Sliders are particularly useful for teaching and learning transformations. Rather than memorizing that a coefficient changes steepness or that a constant shifts a graph, I can vary one part and observe the effect. The important discipline is to alter one parameter at a time. If several sliders move together, the result may look impressive but teach very little.
Another good use is checking a hand-drawn graph. I can sketch what I think a function should look like, then enter it and compare the intercepts, direction, and turning behavior. If the two versions differ, I return to the algebra instead of assuming the digital graph is automatically the explanation. Used this way, the app supports mathematical reasoning rather than replacing it.
It is also helpful for exploring edge cases. I can inspect what happens near a discontinuity, compare a function with a restricted version, or see how a parameter changes the number of visible intersections. These are the moments when a graphing calculator becomes a laboratory. The app encourages questions that are difficult to answer by plugging in isolated values.
Where it compares well with ordinary alternatives
Compared with a basic calculator, Desmos is much stronger for relationships and patterns. A basic calculator may be quicker for a single percentage, square root, or arithmetic expression, particularly when I do not need a graph. For those small tasks, opening a dedicated graphing workspace can feel unnecessary.
Compared with a physical graphing calculator, the app is easier to obtain and more visually approachable for many learners. The phone interface also makes it convenient to keep nearby. On the other hand, a physical calculator can be preferable in settings where phones are not allowed, or where tactile buttons and a dedicated device make focused work easier.
Compared with a general spreadsheet, Desmos is more natural for seeing mathematical curves and changing parameters interactively. A spreadsheet is often better for large lists of records, repeated business calculations, or data arranged across many columns. I would not choose Desmos as a replacement for a full data-analysis workflow.
Compared with a computer algebra system, it feels less intimidating and more immediate for visual exploration. A specialized symbolic tool may be better when I need advanced manipulation, formal derivations, or a broad range of technical mathematics. Desmos earns its place by making the graph central, not by trying to be every kind of mathematical software at once.
Who will get the most from it
I recommend it most strongly to students learning algebra, functions, coordinate geometry, and introductory modeling. It is also useful for teachers who want to demonstrate a concept live. A slider can make a transformation visible in seconds, and the graph gives students something concrete to discuss instead of leaving the lesson at the level of notation.
It suits curious learners as well. If I wonder how two functions compare, whether a curve crosses a line, or how changing one value affects a model, I can test the idea quickly. That experimental quality is more valuable than a long feature list because it changes how I approach a problem.
I would be more cautious about recommending it to someone who only needs routine arithmetic, extensive data processing, or advanced symbolic computation. In those situations, a basic calculator, spreadsheet, or specialist mathematics program may be a better fit. The app is not weak because it lacks every possible tool; it is focused, and that focus creates clear boundaries.
Everyday scenario: checking homework without hiding the reasoning
Imagine I am helping a student with a pair of linear equations after dinner. Instead of entering numbers until an answer appears, I would graph both lines, inspect where they meet, and then use the table to check nearby values. If the intersection looks wrong, I would examine the expressions for a misplaced sign or coefficient.
Next, I might add a slider to one coefficient and ask how the intersection changes. That turns a five-minute answer check into a short lesson about sensitivity. The student can see that a small algebraic change may move the solution substantially, while another change may barely affect it.
The limitation is that the app can make an answer look convincing even when the original equation was misunderstood. I would always ask the student to explain what each expression represents. The graph is evidence, not a substitute for reading the problem carefully.
Small habits that make the app easier to use
- Build graphs in layers: enter the main expression first, confirm its shape, and only then add comparisons or parameters.
- Use tables as a check: a curve can look plausible while a table reveals an input mistake or an unexpected value.
- Change one slider at a time: this keeps cause and effect visible and makes the experiment easier to explain later.
- Keep complex work readable: hide temporary expressions instead of deleting them, and leave useful labels when a graph will be revisited.
- Choose the screen for the task: a phone is convenient for a quick check, while a larger display is more comfortable for crowded graphs.
Value, reach, and the practical verdict
There is little financial risk in trying it because the app is free. Its broad reach is reflected in more than ten million installs, while an average score of 4.6 from roughly thirty-six thousand ratings suggests that many users find the approach effective. I do not treat popularity as proof that it will suit everyone, but it does make the app an easy recommendation to test for school or personal study.
Desmos Inc has kept the product’s identity clear: this is an education app built around interactive graphing. It was released on December 18, 2014, and the current version shows that it remains an actively maintained tool rather than an abandoned calculator concept. The Everyone age classification also makes it approachable for a wide range of learners.
My final view is straightforward: Desmos is most valuable when you want to see why a mathematical answer behaves the way it does. It feels quick for ordinary graphing, stays useful as an investigation grows, and makes functions easier to discuss. Its main weaknesses are practical ones—dense input on a small screen, visual clutter in complex work, and the fact that it is not a complete replacement for a spreadsheet, physical calculator, or advanced symbolic system.
If you are learning functions or helping someone understand them, I would install it without hesitation. If you only need occasional arithmetic, it may be more tool than you need. For everyone in between, the best test is to recreate one real problem, add a table, and vary a parameter. If seeing the relationship helps you think, this free graphing calculator has earned a permanent place in your study toolkit.
Desmos Graphing Calculator Frequently Asked Questions
Is Desmos Graphing Calculator easy to use on a phone or tablet?
Desmos is designed to make graphing approachable, and entering expressions lets you see their graphs without needing to draw them by hand. The screen can feel busy at first because the app includes tools for tables, sliders, and interactive exploration. Taking time to try one feature at a time makes the interface easier to understand, especially on a smaller phone screen.
Can I save or share graphs I create in Desmos?
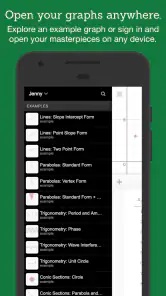
Desmos is useful for creating graphs that you can revisit or share, which can help when working on class assignments or explaining a mathematical idea. Sharing and cloud-related options may depend on the feature and your connection, so check how you plan to use them before relying on them. For a graph you need later, make sure it is saved or otherwise accessible on your device.
Can Desmos Graphing Calculator help me learn math if I’m new to graphing?
Yes. Desmos makes mathematical relationships visible by letting you plot expressions and explore how changes affect a graph. Its interactive approach can help connect equations with their shapes, which is useful when learning graphing for the first time. The range of tools may take practice to navigate, so it is best to explore the interface gradually and use the graphs to support—not replace—your understanding of the underlying math.
What devices can I install Desmos Graphing Calculator on?
Desmos Graphing Calculator is an education app developed by Desmos Inc and is available for Android and iOS. On Android, the required operating system is version 10 or later. The app is free to download, and its content rating is Everyone, making it broadly suitable for users of all ages. Check that your device meets the operating-system requirement before installing.
What is Desmos Graphing Calculator used for?
Desmos Graphing Calculator is a digital tool for plotting equations, exploring mathematical relationships, and checking calculations. It supports functions, tables, inequalities, sliders, points, and interactive graphs. Students can use it for algebra, geometry, trigonometry, statistics, and calculus, while teachers may use it to demonstrate concepts visually. It is more powerful than a basic calculator, but beginners may need some time to learn all its graphing features.
Pros
- Plots functions
- inequalities
- points
- and tables in one workspace.
- Interactive sliders make exploring parameters quick and intuitive.
- Supports regression models for fitting data from tables.
- Expressions update instantly while you edit them.
- Works well for classroom demonstrations and independent study.
Cons
- Advanced features can feel hidden to first-time users.
- Large graphs may become cluttered with many expressions.
- Requires internet access for some sharing and syncing features.
- Limited symbolic algebra compared with dedicated computer algebra apps.
- Small-screen editing can be awkward on phones.

- Category
- Education
- Version
- 7.49.0.0