Stock Signals & AI Forecasts
- 19.00
- 4.4
- Installs
- 50.00K
- Price
- Free
Screenshots
Analysis by Reviewed
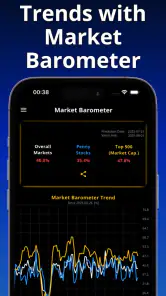
I approached Stock Signals & AI Forecasts as a learning and decision-support tool rather than a magic button for picking winners. It is a free finance app from Loheden AI Solutions AB, built around stock-trading signals, portfolio simulations, and technical-analysis tools. That combination makes it interesting for someone who wants to practise reading market information before putting real money at risk, but it also means the app rewards patience more than impulse.
My first impression was that the app is aimed at people who want more structure than a simple price chart provides. Instead of treating a stock as only a number moving up or down, I could approach it through signals, simulated portfolio choices, and chart-based analysis. That makes it more useful for building a repeatable routine than for checking a quote once and closing the app.
The app has a 4.4 average from around 756 ratings and has passed 50 thousand installs, so it is not an obscure experiment with no user history. It is rated for Everyone, and the minimum operating-system requirement is Android 7.1. The current release is version 2.2.53. Those details make it accessible to many older Android devices, although the quality of the experience will still depend on screen size, speed, and how comfortably you can study charts on your phone.
What the first session is really like
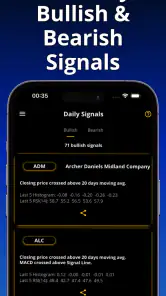
Before opening it, I would set one expectation clearly: a signal is not the same thing as a guaranteed result. A signal can help me notice a technical pattern or create a reason to investigate a stock, but it cannot remove market risk. The most productive way to use this app is to ask, “What does this signal suggest, and what would make me reject it?” rather than, “Which button tells me what to buy?”
That distinction matters especially for beginners. Technical indicators can look precise because they are presented visually, yet they are still interpretations of past and current price behaviour. A simulated portfolio is therefore valuable because it lets me test whether my interpretation is sensible before I connect it to a real brokerage account or make an actual trade elsewhere.
The free entry point is helpful for trying the workflow without committing money immediately. The app also offers in-app purchases ranging from $14.99 to $79.99 per item. I would not treat those purchases as a necessary first step. A new user should first learn what the free experience can do, understand the signal language, and decide whether the routine fits their habits. Paying for more should come only after the basic process is genuinely useful.
Compared with a standard finance app, this one feels more focused on interpretation and practice. A typical market app may be better for checking balances, reading company news, or placing orders through a broker. This app is more relevant when I want to examine a setup, record a hypothetical decision, and see whether my reasoning survives over time. It is not a replacement for a regulated brokerage account, and I would not use it as my only source of information before investing.
Start with a small question, not a large portfolio
On a first visit, I recommend choosing one simple question. For example: “Can I identify a signal, explain why it matters, and follow what happens next?” That is a better starting point than trying to build a diversified virtual portfolio immediately. Limiting the first session gives the charts and technical tools room to teach you something instead of turning the screen into a collection of unexplained indicators.
I would also keep a short note outside the app with the date, the signal I noticed, and the reason I considered it interesting. This is one of the most useful habits the app encourages indirectly. Without a note, it is easy to remember only the decisions that worked and forget the ones that failed. With a note, the simulation becomes a record of my process rather than a string of emotional guesses.
Setting up a useful first workflow
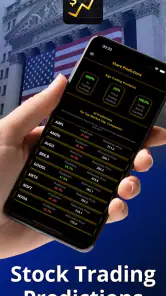
The initial setup should be treated as orientation. I would browse the available stock view, locate the technical-analysis area, and inspect how signals are represented before trying to act on them. If the interface presents several indicators, I would begin with one or two rather than enabling everything. A crowded chart can create the illusion of confidence while making it harder to see what each tool is actually telling me.
A practical beginner workflow looks like this:
Choose a stock or market idea that you already understand at a basic level.
Look at the price movement and identify the time context before reading the signal.
Open the technical-analysis tools and study one signal at a time.
Write down the reason for a simulated decision before checking whether the result is favourable.
Review the decision later and separate a good process from a lucky outcome.
This sequence is more valuable than chasing the most dramatic signal on the screen. It also answers a question many first-time users have: “What should I do if I do not know which indicator matters?” My answer is to choose the simplest available view, learn its purpose, and avoid combining tools until you can describe each one in ordinary language.
Another useful adjustment is to separate discovery from action. I might use the signal view to find something worth researching, then use the chart to check whether the price context supports that idea. If the two views do not agree, I would not force a decision. That disagreement is information. It may mean the setup is unclear, or simply that the app has helped me avoid acting too quickly.
The first meaningful success
For me, the first real success with this app would not be a simulated profit. It would be completing a decision that I can explain from beginning to end. I would select a stock, inspect its signal, note the technical reason, create a hypothetical portfolio action, and return later to compare the result with my original expectation. That creates a complete learning loop.
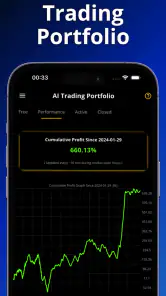
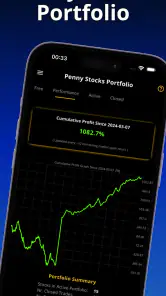
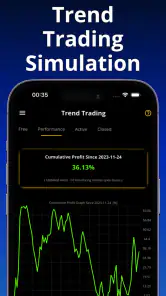
This is where the portfolio-simulation side becomes more than a decorative feature. It gives beginners a place to test position ideas without immediately confusing practice with real ownership. If a simulated choice goes badly, I can investigate whether I misunderstood the signal, entered too late, ignored the wider trend, or simply encountered an unpredictable move. Each explanation leads to a different lesson.
A realistic everyday scenario would be a short evening review after work. I might spend a few minutes checking a watchlist, choose one stock that has caught my attention, and record a simulated decision rather than buying it immediately. The next evening, I would review what changed and whether my original reason still made sense. This routine is manageable because it does not require constant monitoring, and it discourages the habit of reacting to every small movement.
The best early win is learning to wait for a reason you can state clearly. That sounds modest, but it is exactly the kind of discipline that many signal-based tools fail to encourage. The app becomes more useful when I use it to slow down, compare ideas, and observe consequences instead of treating every alert or visual cue as an instruction.
Where beginners can become confused
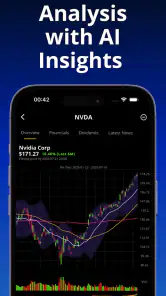
The word “AI” can create unrealistic expectations. I would not assume that an AI forecast knows the future or understands my personal financial situation. Forecasts and signals are still inputs for judgement. They may help organise information, but they do not know whether I need the money soon, how much loss I can tolerate, or whether a particular investment fits my wider finances.
Another common confusion is the difference between a simulated portfolio and a live investment account. A virtual result does not include the emotional pressure of real money, and it may not reflect every practical issue involved in trading outside the app. I would use the simulation to test ideas and habits, not as proof that I am ready to trade with savings.
Technical analysis can also tempt users to add too many tools. When several indicators appear to support the same direction, it is easy to believe the conclusion is stronger than it really is. In practice, those indicators may be responding to related price information. My advice is to change one part of the method at a time and keep a record of what changed. That makes the learning process slower, but far more honest.
The app may also feel less satisfying to someone who wants a complete personal-finance dashboard. If my main need is budgeting, bill tracking, tax preparation, or direct order execution, I would choose an app designed for those jobs. Stock Signals & AI Forecasts makes more sense beside those tools, not necessarily instead of them.
How I would use the signals responsibly
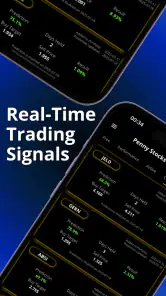
I would treat each signal as the beginning of a checklist. First, I would ask what the signal is measuring. Then I would consider the direction and recent context shown by the chart. After that, I would decide what evidence would make me abandon the idea. This final question is important because a plan without an exit condition can turn a small mistake into a stubborn commitment.
I would also avoid judging the app by one successful or unsuccessful prediction. A single outcome says very little. The more meaningful test is whether the app helps me follow a consistent method across many simulated decisions. If I cannot explain why I acted, then a profitable result may have been luck. If I can explain the process and improve it after a loss, the app has still provided value.
One non-obvious advantage of this approach is that it exposes my own habits. I may discover that I only select signals after a stock has already moved, or that I abandon a method after one disappointing result. The app cannot correct those biases automatically, but its combination of signals and simulations gives me a place to notice them. That is a stronger benefit than simply receiving another directional suggestion.
There is a trade-off, though. The more seriously I use the tools, the more time I need to spend interpreting them. This is not a one-tap investing shortcut. Someone who wants a passive, hands-off approach may find the analysis unnecessary. Someone who enjoys learning how market signals behave will probably get more from it.
Who should install it, and who should skip it
I would recommend it to a beginner who wants a gentle bridge between curiosity and disciplined practice. It suits someone who has seen technical charts but does not yet have a reliable workflow, as well as a more experienced investor who wants a separate space for testing ideas. The free access makes it reasonable to explore before considering any paid option.
I would be more cautious about recommending it to a person looking for personalised financial advice. The app can support research and simulation, but it should not decide how much of someone’s income belongs in stocks. It is also not the right primary tool for users who mainly need banking, budgeting, retirement planning, or direct brokerage functions.
It may also be a poor match for anyone who finds charts stressful or who tends to make rapid decisions after seeing a strong-looking signal. In that case, a simpler long-term investing approach may be safer and easier to follow. The app is most helpful when it adds structure to curiosity, not when it amplifies urgency.
What to do after the first session
After completing one simulated decision, I would resist the urge to add many more immediately. Instead, I would repeat the same workflow with a different market situation and compare the reasoning. Did I rely on the same signal? Did the chart context change my view? Did I record a clear reason before seeing the outcome? These comparisons reveal whether I am learning a method or merely searching for confirmation.
If the process feels useful after several sessions, then I would explore the app’s wider technical-analysis options more carefully. I would still keep the simulation separate from real money and use independent research for company fundamentals, news, and personal financial planning. This division of labour is sensible: the app can help with market-pattern practice, while other resources answer questions it is not designed to settle.
Paid items deserve the same measured approach. Since purchases range from $14.99 to $79.99 per item, I would only consider them after identifying a specific limitation in my current workflow. Paying because the word “AI” sounds promising is not a good reason. Paying because a particular addition solves a problem I repeatedly encounter is a more defensible decision, provided the cost fits my budget.
Overall, I found Stock Signals & AI Forecasts most convincing as a practice companion. It gives first-time users a path from seeing a signal to forming a hypothesis, testing it in a simulated portfolio, and reviewing the result. That is a more responsible journey than jumping straight from a colourful chart to a real trade.
My recommendation is to install it if you want to learn a repeatable way to study stock signals, not if you want certainty. Loheden AI Solutions AB has positioned the app around a useful combination of forecasts, technical tools, and portfolio simulation. Used calmly, it can make market research more organised and reveal weaknesses in your decision-making. Used as an unquestioned prediction engine, it will disappoint. For a free finance app with an Everyone rating and a broad Android reach, it is worth trying—provided you keep the first goal small, write down your reasoning, and let practice come before risk.
Pros
- AI forecasts help identify potential market trends quickly.
- Supports multiple assets
- including stocks
- crypto
- and forex.
- Signal history makes it easier to review past recommendations.
- Custom alerts can notify you when selected signals change.
- Clean interface is approachable for beginners and casual investors.
Cons
- Forecast accuracy can vary significantly during volatile markets.
- Some advanced signals or tools may require a paid subscription.
- Signals are not personalized financial advice for your portfolio.
- Frequent alerts may encourage impulsive or excessive trading.
- Market data and forecasts may occasionally be delayed.
- Category
- Finance
- Version
- 2.2.53