Realtime Charts for Torque Pro
- 69.00
- 4.2
- Installs
- 10.00K
- Price
- $2.49
Screenshots
Analysis by Reviewed
I like the idea behind Realtime Charts for Torque Pro: turning vehicle readings into a visual picture you can follow, rather than a string of numbers you have to interpret. The important detail is that this is a companion plugin for Torque Pro, not a standalone car-diagnostics app. If you already use Torque Pro and want to watch changing readings as they happen, that focused role makes sense; if you expect a complete vehicle toolkit by itself, this is not the place to start.
Why a live chart can be more useful than a reading
A number tells you what a sensor reports at one moment. A chart can show whether that value is steady, rising, or changing in step with something else. That difference matters when you are trying to understand behavior rather than simply check a single reading. I find live visualization most useful for noticing a pattern during a specific drive, not for treating a graph as a diagnosis on its own.
The plugin is made by Crystal Lake Apps LLC and costs $2.49. It has a 4.2 average from around 370 ratings, with over 10,000 installs. Those figures suggest an established niche audience, though they cannot tell you whether it suits your particular vehicle or what you want to monitor. Its Everyone age rating makes it suitable for a broad audience, but using vehicle data still takes patience and a willingness to learn what the readings mean.
Getting Under the Hood
So, what exactly does Realtime Charts for Torque Pro do? Essentially, it takes all those cryptic data points your car spits out and transforms them into easy-to-read charts. Imagine being able to see your car's performance stats in real-time, on your smartphone. It feels a bit like stepping into the future, or at least leveling up in the car-owner game!
Features That Make You Go "Wow"
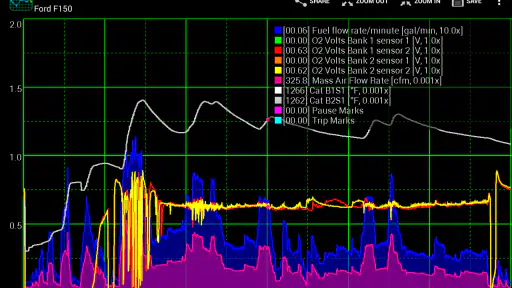
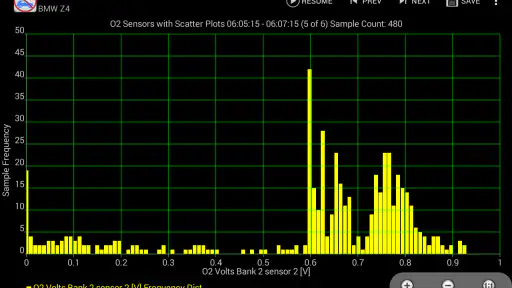
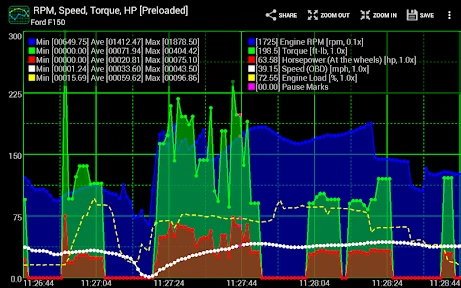
First off, the real-time graphing is a game-changer. You get to see live data streams from your car’s sensors, letting you monitor everything from engine performance to fuel efficiency. And the best part? You can customize these charts to focus on the parameters that matter most to you. It's like having a bespoke dashboard for your vehicle.
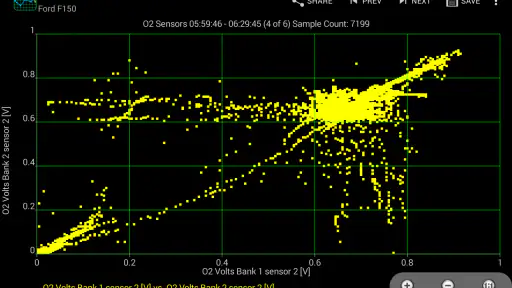
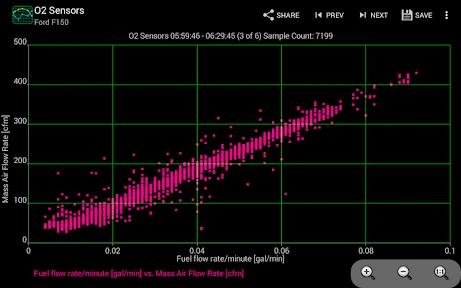
The app doesn’t stop there. It also offers historical data analysis. This means you can look back at your car's performance over time, helping you spot trends or potential issues before they become costly repairs. Plus, for those of us who love to geek out over data, you can export all this info for further analysis.
Using the charts without turning a drive into a test
My practical advice is to decide what question you want the chart to help answer before you start watching it. For example, if you are checking whether a reading changes during ordinary acceleration, focus on that one parameter and keep the route and driving conditions as consistent as you reasonably can. Trying to track everything at once makes the display busier without necessarily giving you a clearer answer.
More From Our News Desk

Clash of Clans Is Won Between the Battles

Android Auto Makes the Case for Quieter Car Software

MobiOffice: Transforming Mobile Productivity with Seamless Integration

EA SPORTS FC™ Mobile Soccer: Redefining Mobile Sports Gaming

How Microsoft OneDrive Became a Mobile Productivity Giant

How Google Translate Breaks Language Barriers Effortlessly
A sensible everyday scenario is a driver who has noticed a change in how the car behaves and wants to gather context before talking with a mechanic. A graph may help show whether a selected reading shifts at a particular point in a trip. That is useful as an observation to share, not proof of a fault or a substitute for a proper inspection. I would set up the view while parked, then keep my attention on the road rather than trying to interpret a phone screen while moving.
Interface and Usability
Now, you might be thinking, "This sounds complicated." But fear not! The interface is surprisingly user-friendly. It's designed with simplicity in mind, which means even if you're not super tech-savvy, you can still navigate through the app without pulling your hair out. The color-coded charts are intuitive and make it easy to spot what’s going on at a glance.
There is still a learning curve behind that approachable display. A clear line is not automatically a meaningful one: you need to know what parameter you selected and whether the vehicle is reporting it in a way that answers your question. I would begin with a single familiar reading, learn how it behaves in normal use, and only then add another. That small bit of discipline makes comparisons more useful and reduces the temptation to draw big conclusions from a brief fluctuation.
Compatibility and Accessibility
Worried about whether your car is compatible? The app works seamlessly with a wide range of vehicles, thanks to its integration with Torque Pro. Whether you're driving a brand-new model or an old faithful, chances are, this app will work for you. And it's available for both Android and iOS, so no one's left out of the loop.
The key practical question is whether you already use Torque Pro: this plugin depends on that app, so it is not a replacement for it. If you are choosing between this and a generic dashboard or a basic code-reading tool, think about the task. A simple reader is often the better pick when you only need to check a warning or retrieve a fault code. Realtime graphing is more appealing when you want to watch selected values change over a drive. It adds a visual layer to a Torque Pro setup rather than making every kind of vehicle check easier.
Installing the app is a breeze, and the setup process is straightforward. You’ll be up and running in no time, ready to start translating your car’s language into something more understandable.
Trade-offs and who should choose it
Because the charts depend on readings available through the Torque Pro setup, the plugin's usefulness is tied to that wider arrangement. Before paying, I would make sure Torque Pro is already part of the plan and that live charts—not just occasional checks—are something I will actually use. The plugin is priced at $2.49, so it is a modest purchase, but it still makes little sense if the companion app or the chart-focused workflow is not right for you.
The app is best suited to a curious owner who wants to observe vehicle data, a hobbyist who likes comparing readings, or someone preparing clearer notes before asking a professional about a concern. I would skip it if I wanted a hands-off explanation of every warning, a repair guide, or a guaranteed diagnosis. Charts can help organize observations, but they do not remove the need for mechanical judgment.
Choosing what to watch and when
A useful habit is to treat each chart session like a small comparison rather than an open-ended hunt for trouble. Pick one driving condition you can repeat—such as a familiar stretch of road or a similar warm-up—and watch the same reading under roughly similar circumstances. That gives you a more meaningful reference than comparing a cold start on one day with a long, warm drive on another. It also makes the chart easier to explain if you later discuss your observations with a mechanic.
For example, if a car feels different during a regular commute, I would first note when the sensation occurs, then use a chart to see whether a relevant available reading changes around that moment. I would not try to diagnose the cause from the shape alone. Road gradient, traffic, temperature, and how the vehicle is being driven can all affect what you see, so the graph is best used to sharpen a question, not settle it.
Where this plugin fits among car tools
Many drivers only need an occasional warning-light check, and for that job a basic code reader or a straightforward diagnostic app is simpler. Those tools are built around identifying stored codes and may be the more direct choice when the immediate question is, “What warning is this?” A live chart serves a different purpose: it helps you follow changing readings while the vehicle is operating. That distinction matters because a chart-focused add-on is not automatically a better general-purpose diagnostic tool.
Compared with a dashboard that mainly presents a few current values, a graph can make timing and direction easier to notice. The trade-off is that a graph asks more of you: you need to choose a useful parameter, understand what it represents, and avoid reading too much into one short run. I see the plugin as a specialist layer for people already comfortable with Torque Pro, rather than a replacement for a simple reader or a professional scan.
Small workflow choices that improve the result
Before a trip, I would decide which question I am investigating and prepare the chart while parked. Keeping the number of selected readings limited helps the display stay legible, especially if you later want to compare notes with someone else. If the result is unclear, repeating the same kind of drive is usually more useful than adding a pile of extra lines immediately. That approach keeps the session focused and reduces the chance of confusing normal variation with a meaningful pattern.
Historical views and export can also be useful when a single glance is not enough. Rather than relying on memory, you can use the record to compare observations across separate sessions or to keep a clearer account of what happened before a service visit. I would still add simple notes about the driving conditions, because a graph without context can be hard to interpret later. This is a practical benefit for careful owners, but it may feel like unnecessary record-keeping if you only wanted a quick answer.
Final Thoughts
In the end, Realtime Charts for Torque Pro is all about empowerment. It puts you in the driver’s seat when it comes to understanding your vehicle's performance. Whether you're a car enthusiast looking to squeeze out every bit of performance or just someone who wants to ensure their car is running smoothly, this app has got you covered.
So, if you’re ready to take your car knowledge to the next level, give this app a spin. It's like having a crystal ball for your car, minus the mysticism. Happy driving!
The version available is 1.70, and it was released on February 17, 2016. It supports Android 4.0 and later. I would treat the version and operating-system details as practical checks before installing, especially on an older phone; a vehicle-data tool is only helpful if the device you plan to use can run it comfortably alongside Torque Pro.
Who will get the most from it
I would recommend this plugin to someone who already has a Torque Pro routine and wants to understand changes over time, rather than merely collect a number or clear a warning. It is especially appealing if you enjoy careful comparisons and are willing to learn what a selected sensor reading can and cannot tell you. If you rarely look at vehicle data, prefer automatic explanations, or need a definite fault diagnosis, a simpler tool or a qualified mechanic is likely a better fit.
One last expectation check: the app’s value comes from pairing its visual approach with the readings your Torque Pro setup can provide. It will not make every vehicle question straightforward, and a chart does not replace a road-safe driving habit or professional inspection. But when your goal is to observe a specific behavior and communicate it more clearly, I find that focused role genuinely useful.
Realtime Charts for Torque Pro Frequently Asked Questions
Is Realtime Charts for Torque Pro a standalone app, or do I need another app to use it?
Realtime Charts is a plugin for the Torque Pro app, so it is intended to work alongside Torque Pro rather than as a standalone vehicle-monitoring app. The plugin focuses on displaying vehicle information in chart form, while Torque Pro provides the app environment it connects to. If you are considering downloading it, make sure Torque Pro is part of your setup.
What is Realtime Charts for Torque Pro?
Realtime Charts for Torque Pro is an add-on for the Torque Pro app that enhances its functionality by providing real-time graphical displays of various automotive data. It allows users to visualize engine metrics and other performance-related data in real-time, making it easier to monitor and diagnose potential issues with your vehicle. It is listed in the Auto & Vehicles category, and its content rating is Everyone.
How do I install Realtime Charts for Torque Pro?
To install Realtime Charts for Torque Pro, you first need to have the Torque Pro app installed on your Android device. Once you have Torque Pro, you can download Realtime Charts from the Google Play Store. After downloading, simply open the app and it will automatically integrate with Torque Pro, allowing you to start using the charts feature. The app is developed by Crystal Lake Apps LLC, and its listed price is $2.49.
What features does Realtime Charts for Torque Pro offer?
Realtime Charts for Torque Pro offers a variety of features including customizable real-time graphs, historical data tracking, and the ability to monitor multiple vehicle parameters simultaneously. Users can choose which data to display and customize the appearance of the charts for better readability and analysis, aiding in efficient vehicle performance monitoring. These visual displays are useful for drivers who prefer to follow changing vehicle readings as charts rather than rely only on individual values.
Is Realtime Charts for Torque Pro compatible with all vehicles?
Realtime Charts for Torque Pro is compatible with most vehicles that are supported by the Torque Pro app. However, compatibility might vary depending on the vehicle's make, model, and year. It is important to verify that your vehicle's OBD2 system is supported by Torque Pro to ensure that Realtime Charts will function correctly. The add-on depends on the vehicle data available through that setup, so checking Torque Pro compatibility is a sensible step before installing it.
Pros
- Real-time data display enhances monitoring.
- Customizable charts for personalized insights.
- Integrates smoothly with Torque Pro app.
- User-friendly interface for easy navigation.
- Supports a wide range of vehicle sensors.
Cons
- Requires Torque Pro for full functionality.
- Limited to vehicles with OBD2 support.
- May drain battery with prolonged use.
- Occasional connectivity issues reported.
- Interface may seem complex for beginners.
- Category
- Auto & Vehicles
- Version
- 1.70